Client
Cartus Relocation Services
Dates
Project Kickoff - July 2022
MVP Completion - July 2023
Services
UX Research, Product Design
Project Overview
Compensation, referred internally at Cartus as COMP, is a software solution, to run cost projections that accurately estimates the cost to move individuals both domestically or internationally. These moves typically are project based moves that span from 1-4 years and because these are work motivated moves, companies want to make sure they account for all possible expenses that an individual and the individuals family could occur and compensate them properly. COMP allows users to build and deliver comprehensive reports that accurately estimates expenses such as airfare, rental cars, hotel stays, real estate commissions, language training, storage costs, shipping of house hold goods, taxes in departure countries, taxes in destination countries, social taxes and many other expenses. In general each report would contain over 100 line item estimates, that need to be as accurate as possible as they are all significant portions of the total compensation offered.
I was brought in to get this project in motion and served as the lead Product Designer. Cactus had a previous solution, but that product was built by a company that later became a major competitor. That solution was far from ideal, due to it was an expensive solution and it had major short comings that were costing the company time, clients and compounding expenses. It was a priority at Cartus to move the suite of tools to an internal solution that they would resell to clients and provide cost projection services with. I was on this project just under one year and oversaw the strategic design efforts to get the new offering to MVP status.
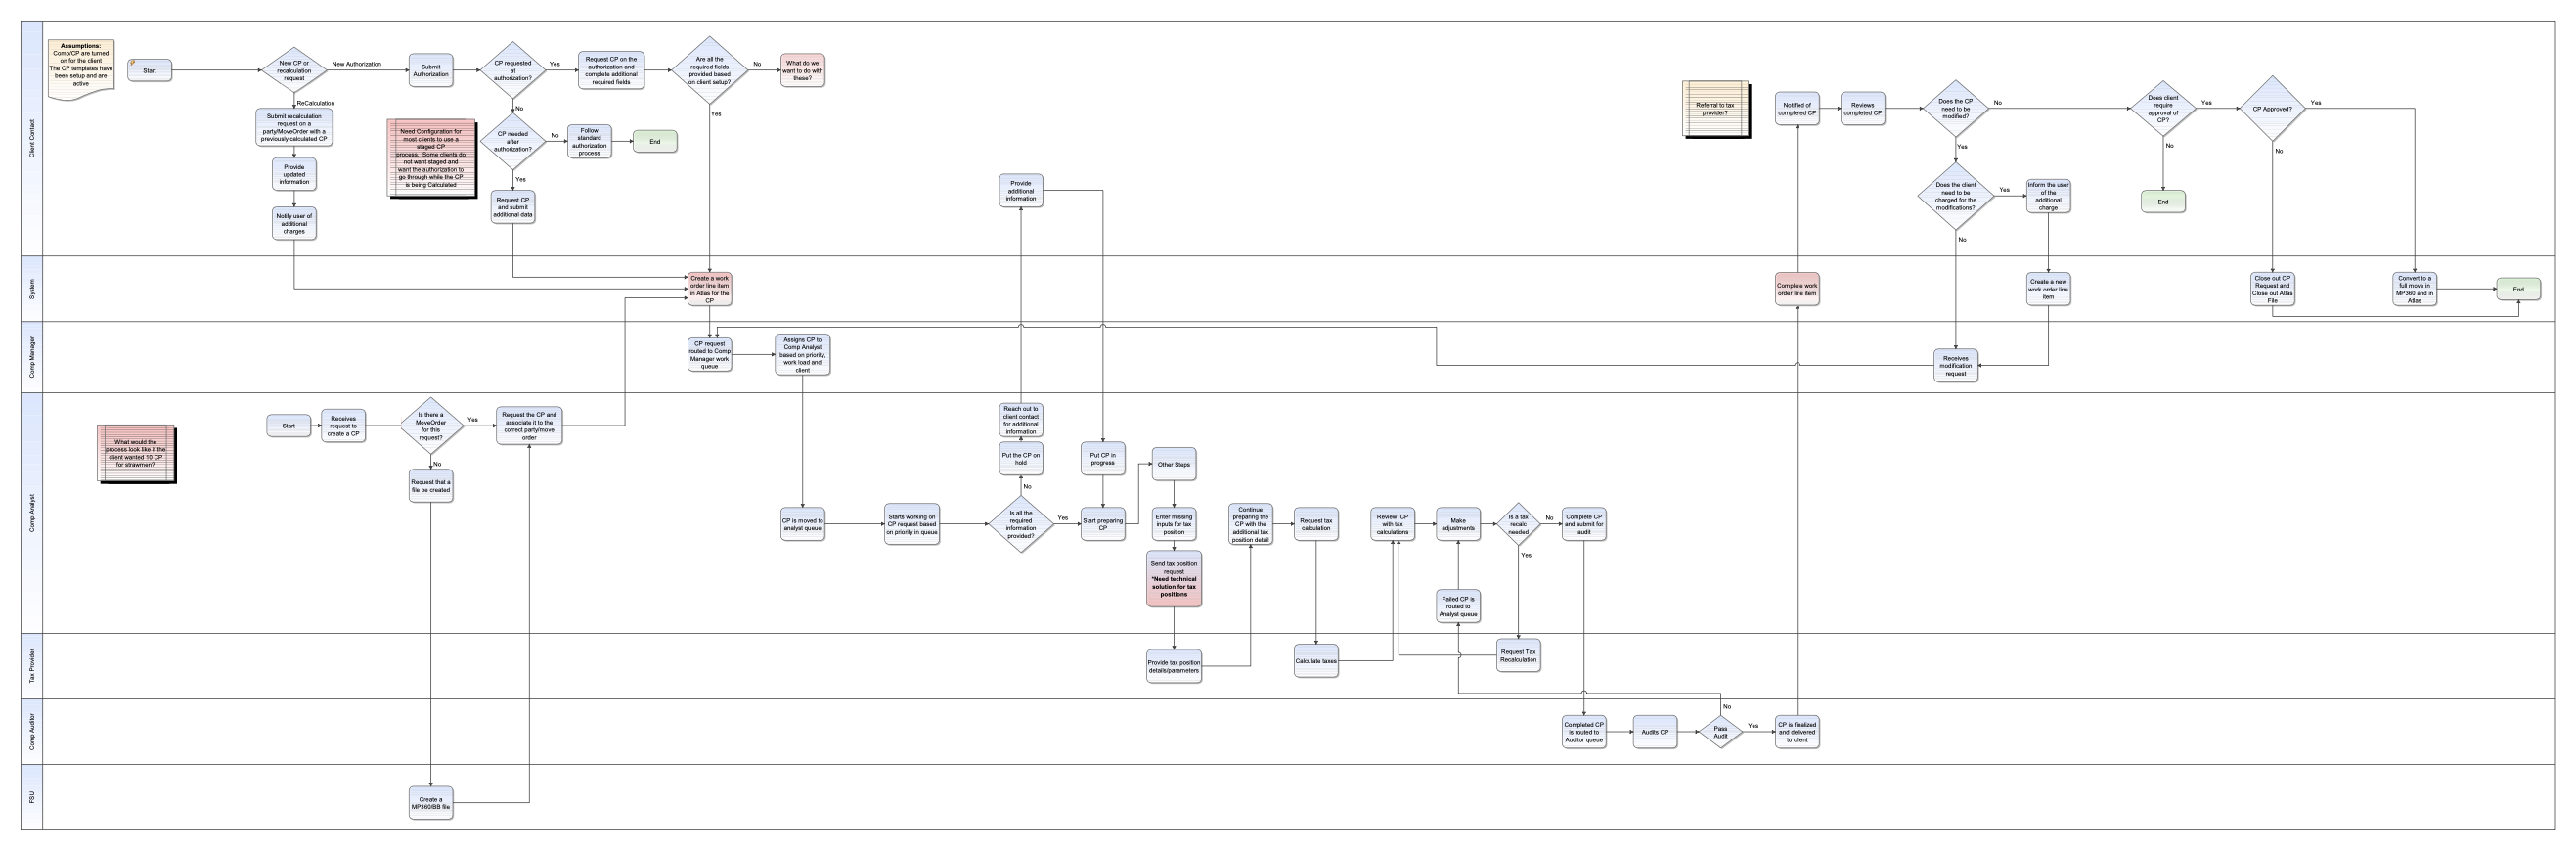
Mapping out a Complex system
Cactus had many products and offered many services that involved multiple teams. It is always wise to have a firm understanding of previous systems before interviewing users and business owners so you're not in the dark as to what they are referencing when mentioning pain points, navigation etc. Two of the main focuses of this project were to get access and an understanding of exactly how the previous solution/software worked. The other first priority, was to get help and map out exactly who did what, when everything happened and map out all components of the processes involved. Cactus had many legacy systems that were intertwined with every solution that needed to also be considered in the redesign.
Research and Interviews
Once I had a good understanding of how everything worked it was time to get feedback on what customers felt was working and what really needed to be improved. Anywhere, Cartus's parent company, did have at my disposal, a UX Research team but time did not allow for their help. Unfortunately there was very little time consideration given for design and developers were lined up to start very early on. Regardless we did get together a script we could run through with everyday system users, clients, trainers and various business owners. From the interviews we pulled our findings together and synthesized the data.
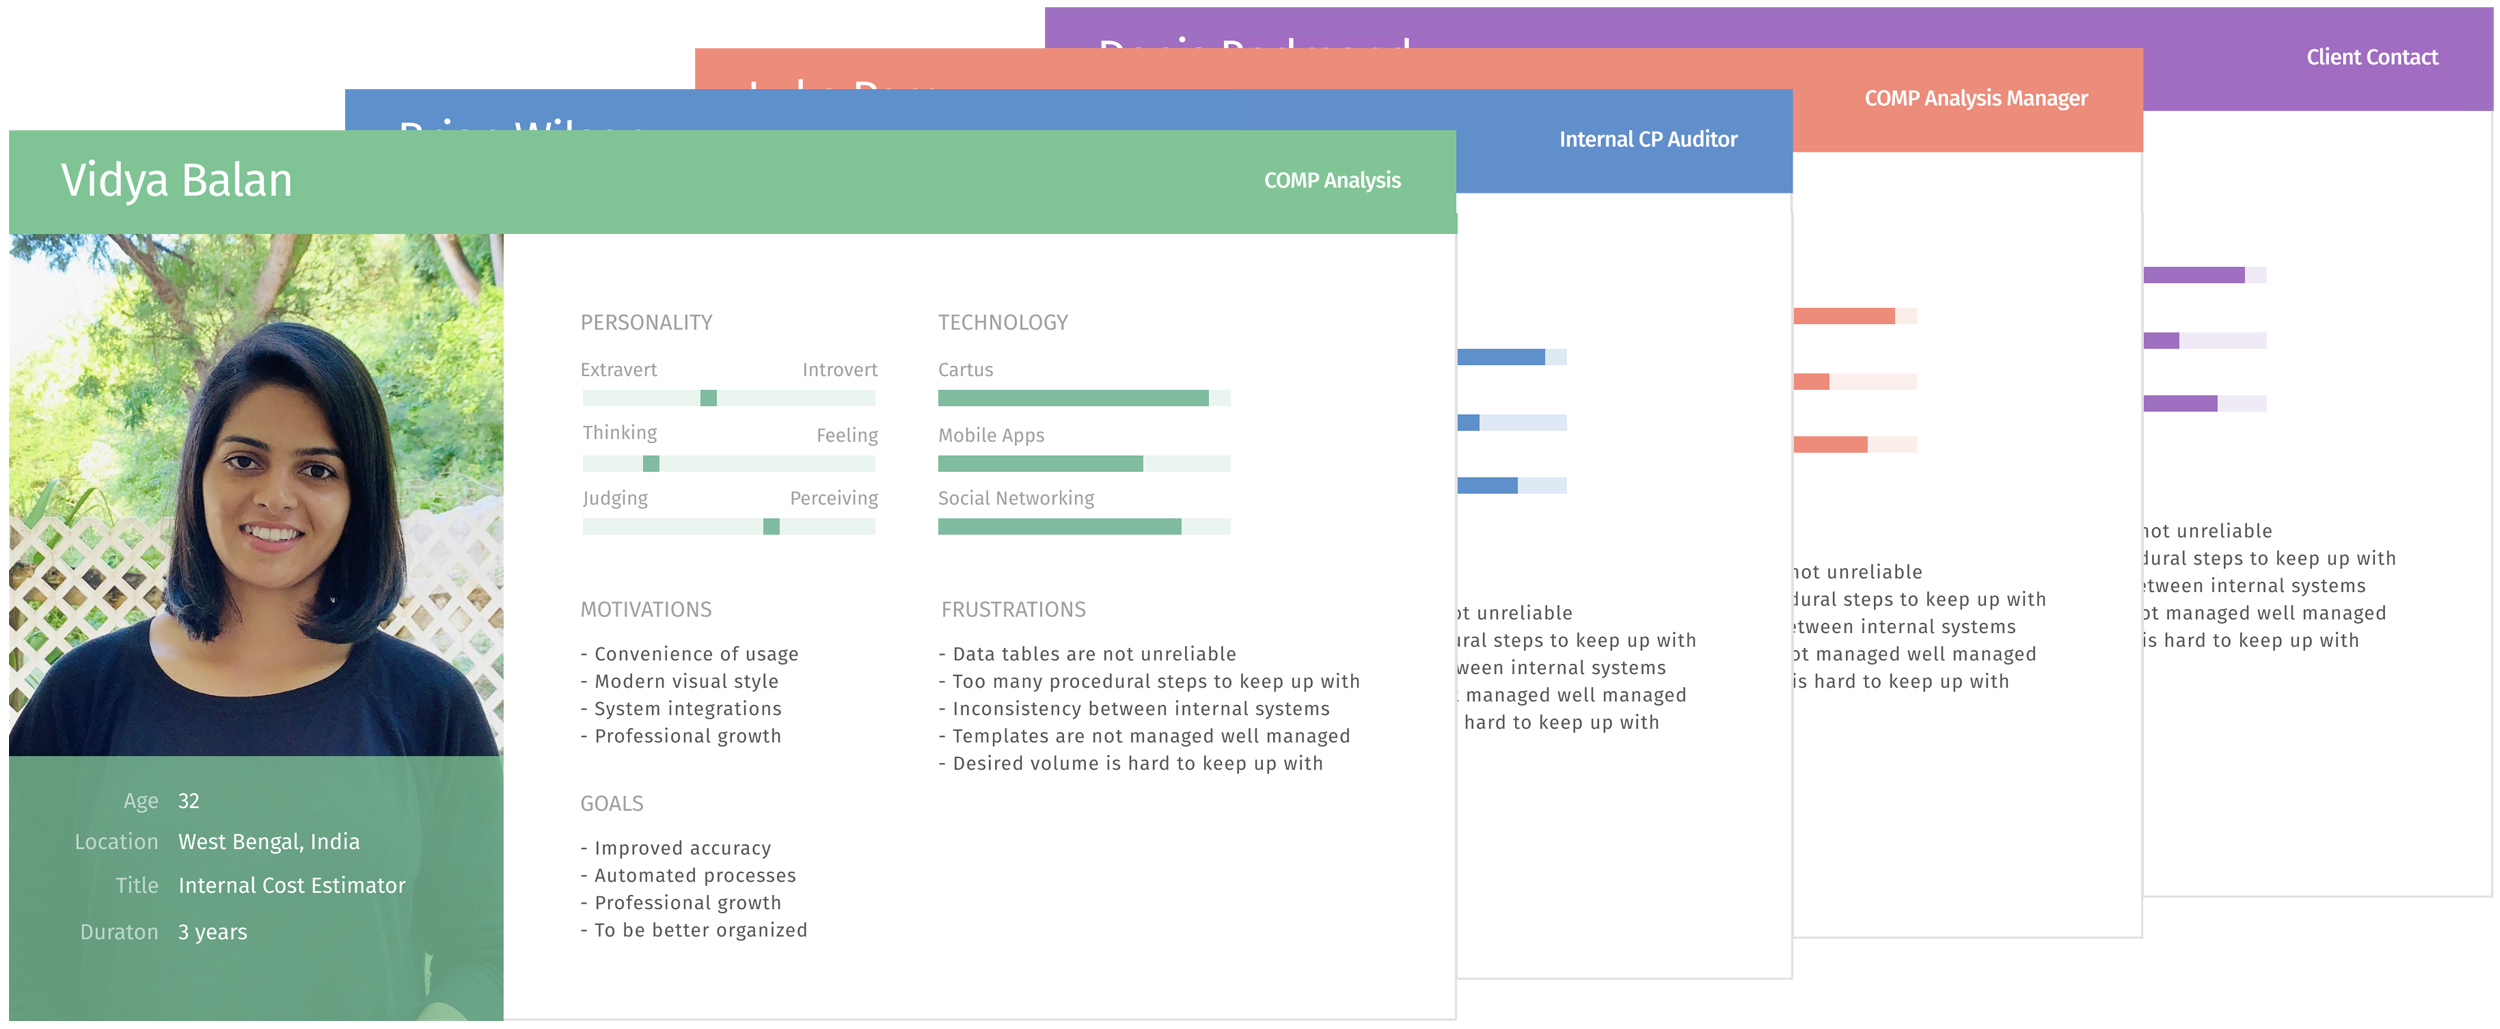
Understanding the Users Through Personas
Based on our research, we recognized that there were four key user types. The main users were referred to as Comp Analysis (CA's), which were a group of about 40 individuals that were internal Cartus employees that ran cost projections daily. They were incentivized to complete high volumes of cost projections each month, as accurately as possible. The second group of users were Auditors who basically only functioned as a second pair of eyes to make sure all line item estimates were calculated accurately. The third group, Clients Contacts, were the clients point person who were given access and the ability to run cost projections and manage the system for their own employees. And lastly, there were managers who could perform any function in the system. They were mainly tasked with setting up global elements such as line items and templates. We identified and interviewed at least 2-3 individuals from each of the user groups. We identified characteristics and what outcome that we would need to accounted for in the designs. Such as howw did each of these users flow through and use the system, what were their unique goals and what would be their unique needs in the new system.
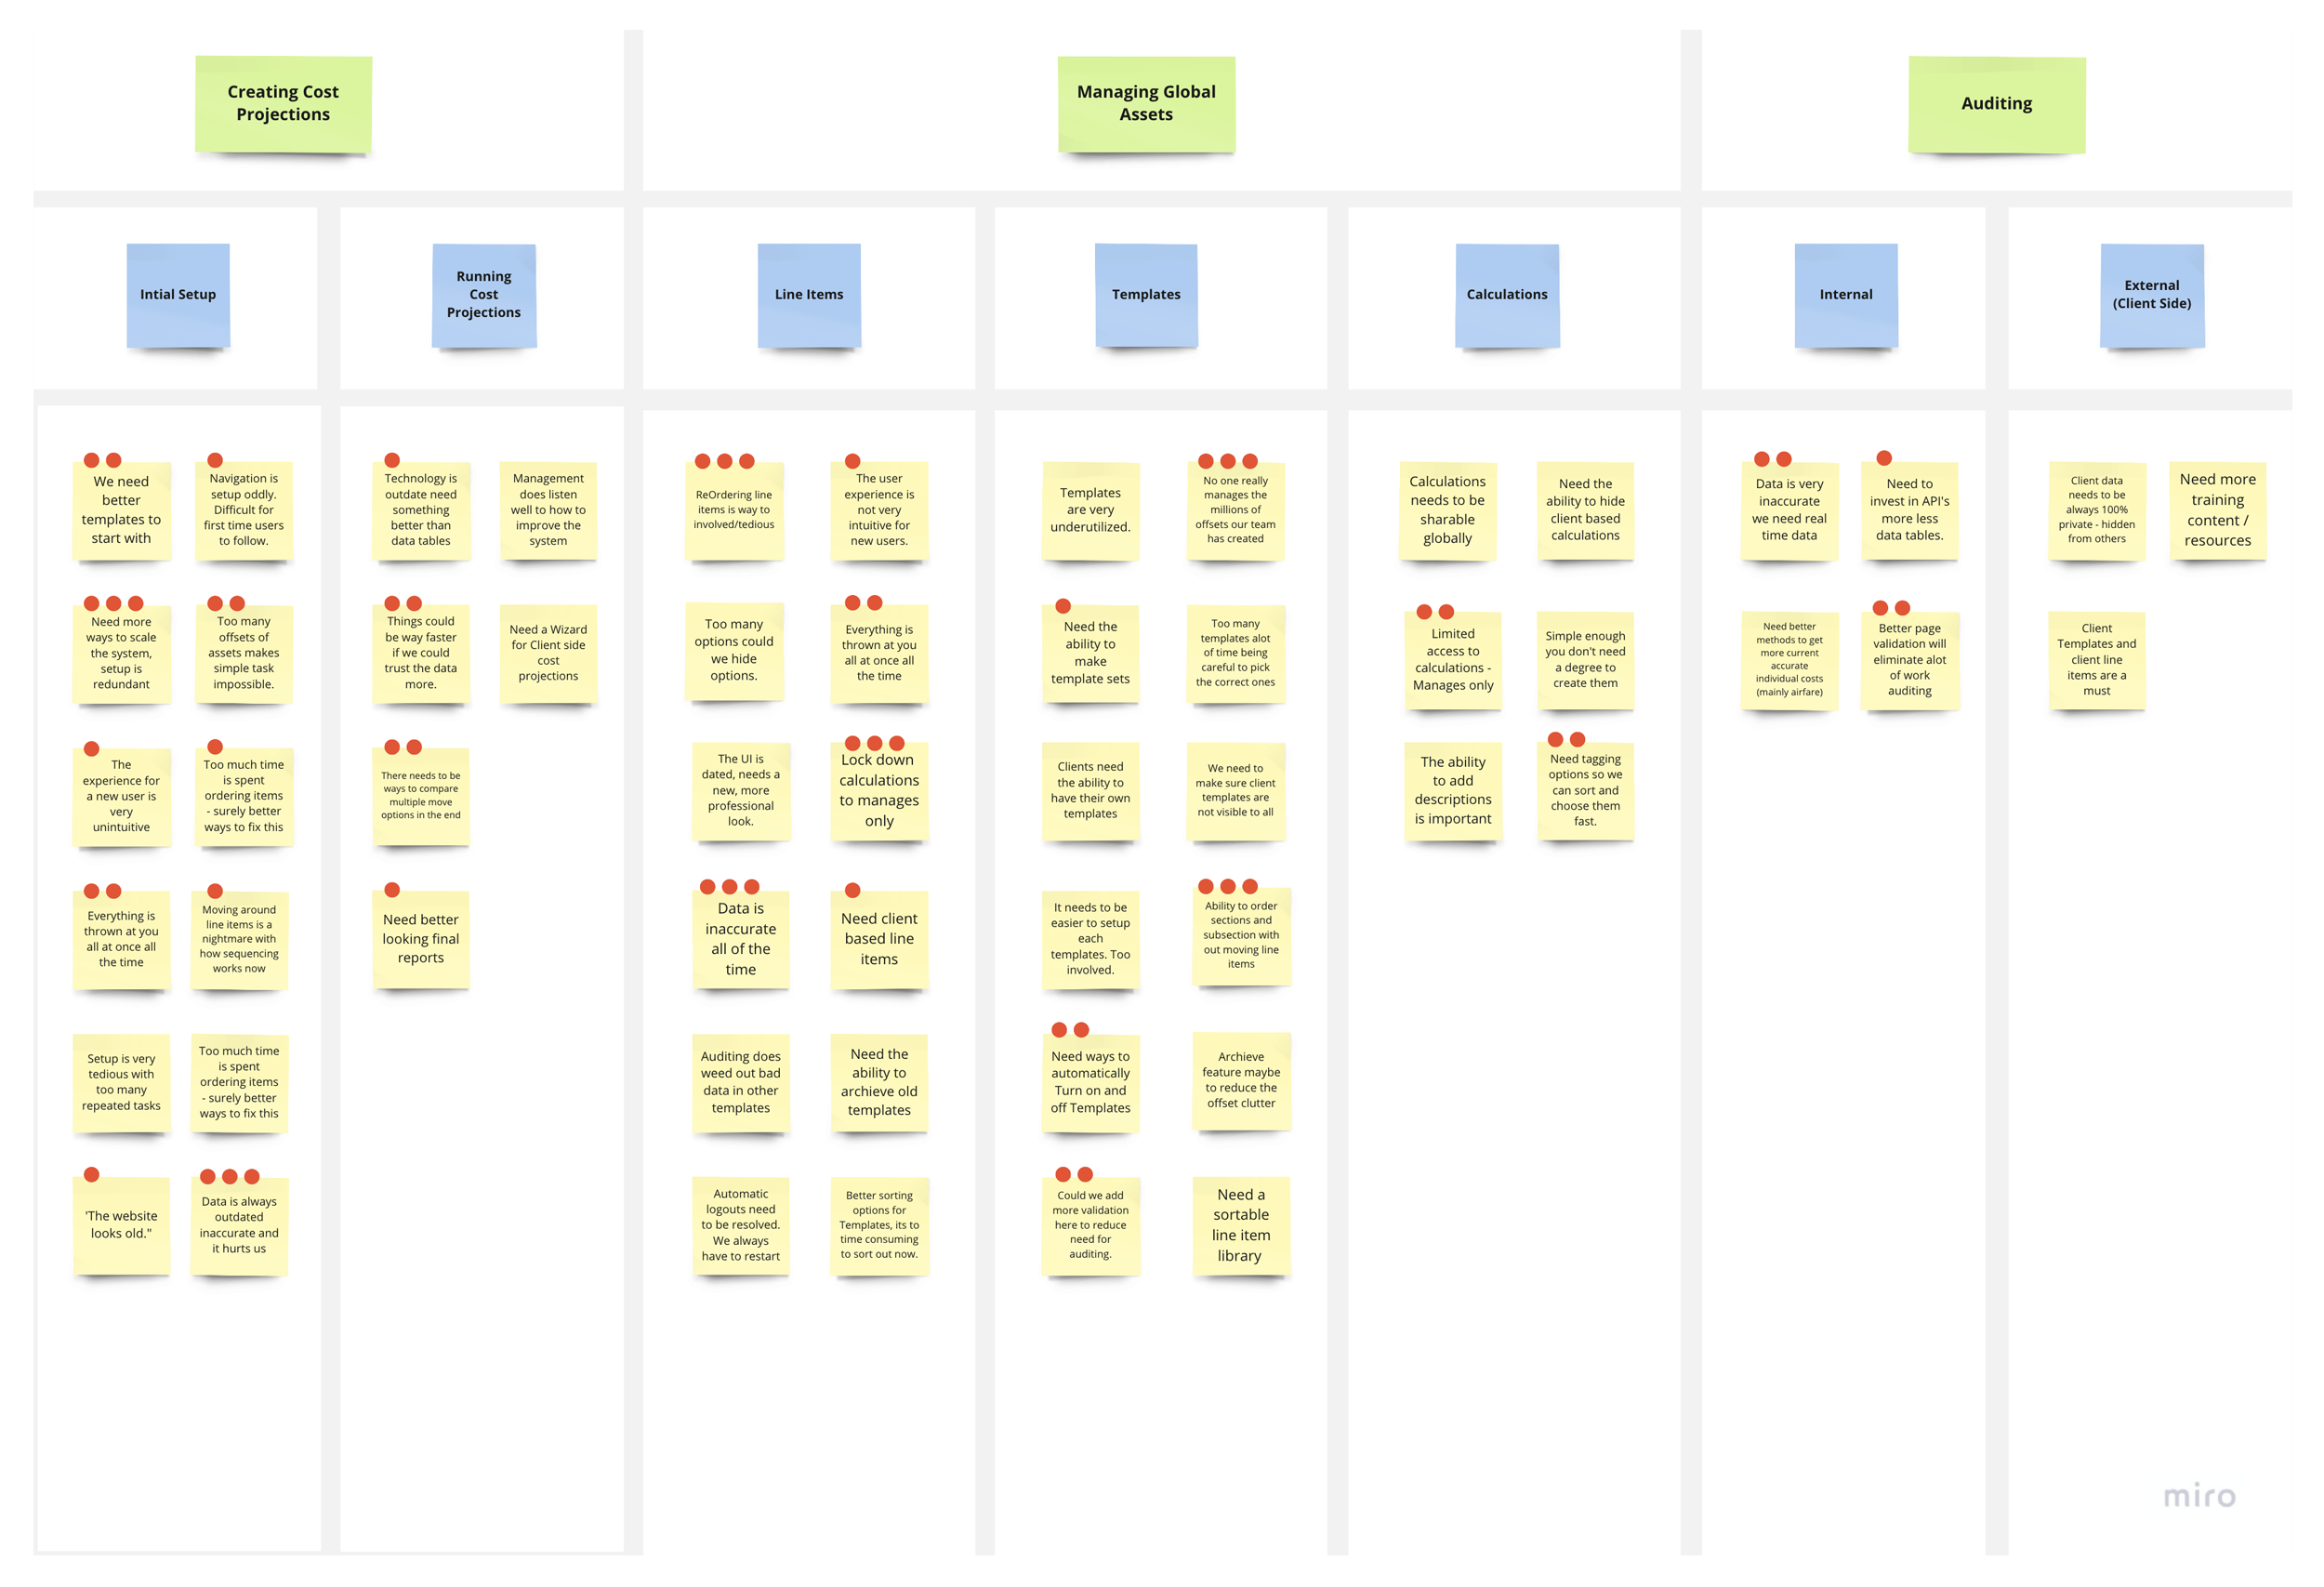
Key Insights
Based on the research we conducted there was definitely themes that surfaced in the interviews. Users really wanted ways to make the content more scalable. The process involved with the previous solution were being voiced as tedious and redundant. A lot of the work they we were doing was work that had previously did and they wanted ways to reuse that. Here are a few of the other main concerns.
Defining the MVP
Now with research finished and a good understanding of the product, its future, and a ton or two of lofty goals, it was time to get realistic about it all. It is at the point we sat down with the development, management and decided when we would get it all done. It is at this time where we decide what will be the MVP or minimum viable product. That is an early version of the product with just enough features to be usable by select customers who can then provide feedback of released features. In our case we decided for MVP, we wanted to develop the ability to create and manage line items, templates and global calculations. We wanted to give the ability to create a full cost projections at this time but did determine that only a few of the line items that were dependent on API's would be available at this time as there were upwards of over 400 lines requiring API's. This case study will focus on merely the MVP, though there were many different areas that COMP went into that we needed to account for and replace before they could only pull the prior solutions offline. We did still have to learn and understand these features to allow room for these as we designed.
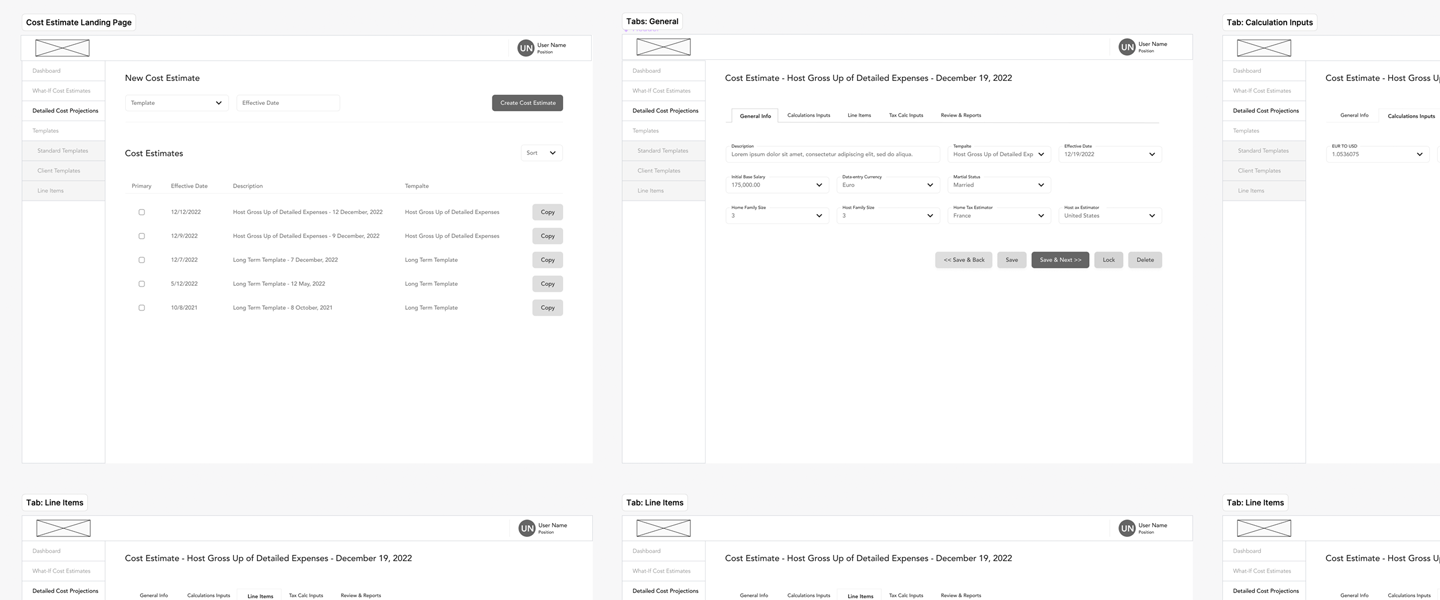
Wireframes
Once I got a good understanding of what the product should be and how users should flow through, it was time to start mocking it up and thinking about the UI. I usually will go through this process with a few of people as I can, to make sure thoughts and designs are solid and then expand into larger approvals. Though out this project when I worked closely with BA and PM who were both extremely versed in the product and other Cartus systems that would need to tie into this one. Once we felt we were on target we moved onto a group of 6 users. That group involved internal CP Estimators, the head of CP Auditing, the head client trainer, as well as the head project manager from Compensation team. Once we got their blessing that we were properly aligned to the objective of the MVP we started meeting with larger group of 19 who we would meet with weekly to share progress with the wireframes through the end of this project. Since there was so many templates and calculations pulling data from various sources there was a lot of liability concerns to make sure we handled it all diligently and it was paramount.
Flushing out a Design System
Now was the time to start looking at creating the final high fidelity UI design solution, so I had to figure out a design system. Unfortunately, this project had been projected to start in development, just a week after my two weeks of onboarding. My hiring had happened a bit late and time tables were not adjusted accordingly. It was expected of me to hand development, finished mockups with just one week allowed for design. Needless to say that was not reasonable, nor realistic, so I pushed back and bought some time but not much so this meant some areas would have to be fast tracked. The Design System was the area I felt we could make up the most ground with.
Also I learned that Cartus had a problem of using outside vendors for new projects and with that they allowed new design systems to creep in each time, so the company had a tangled mess of multiple design systems for me to deal with, once this project was in a good spot (developers had enough work). So instead of adding yet another design system to the collection I had picked the best previous option to move forward with not just for this project but for all Cartus products long term. The plan was to adapt it best as possible to the project then later come back and adapt the other products we could get them all aligned.
Standardizing Line Items
Given the time constraints we decided the line items were the best place to start, as it would keep the developers busy configuring the many API's required, on the back end. That would allow more design time for the rest of the project. One of the main objectives we determined based on our findings was our new systems had to be at another level in concerns of accuracy. The prior solution relied on internal data tables, which were actual Excel data tables in the old system, that managers would update about once per year. This was far from ideal, not the best practice nor was it fair for the team of Comp Analysis, who would be constantly evaluated on accuracy, and although they voiced it they had no control resolving that. Since a report usually contained over 100 line items, it was highly possible the report would have some sort of inaccuracies.
In the past if you had a line item for say something like, Airfare, it was accessed in a lookup table. The table could of been created a over a year ago many times the person configuring the table might use approximates for locations. So say if the transfers were in a small town they would have to use the closest city. This too opened door for inaccuracies. the best way to make the new system more accurate was to implement the use of API's in the line items so COMP Analysis could fetch accurate real time data and not rely on any approximated old static data. Given air faire was only one of the many types of line items which we needed methods to globally configure the line items so they could be reused in each cost projection. We also wanted any complex calculations that were in any line item to be global as well.
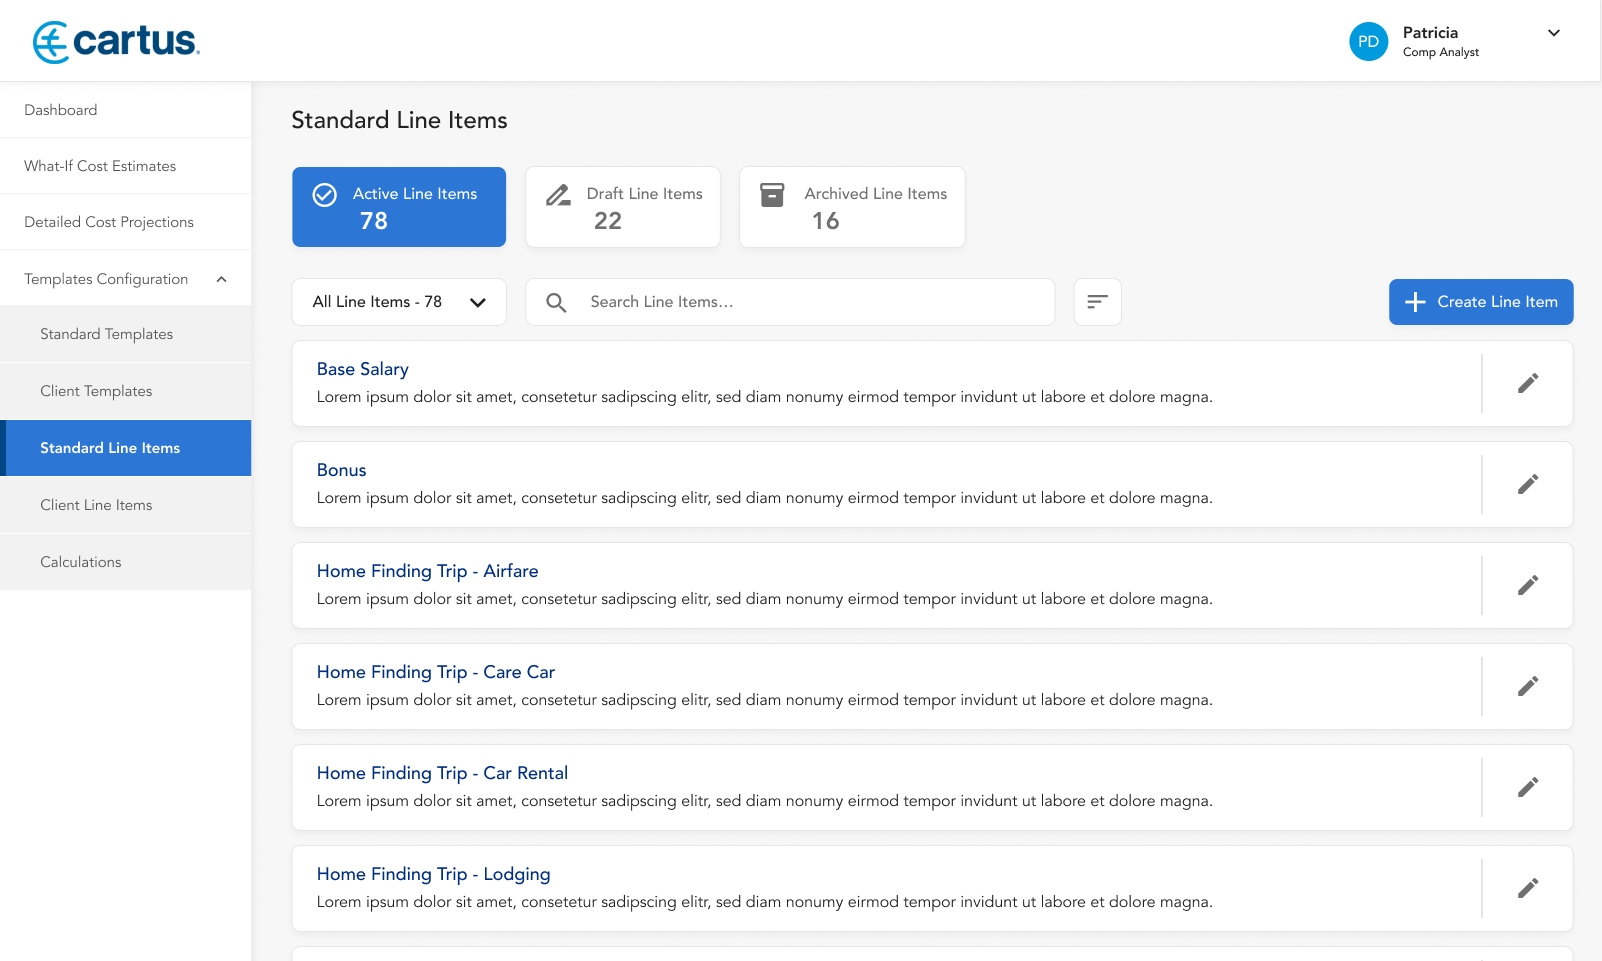
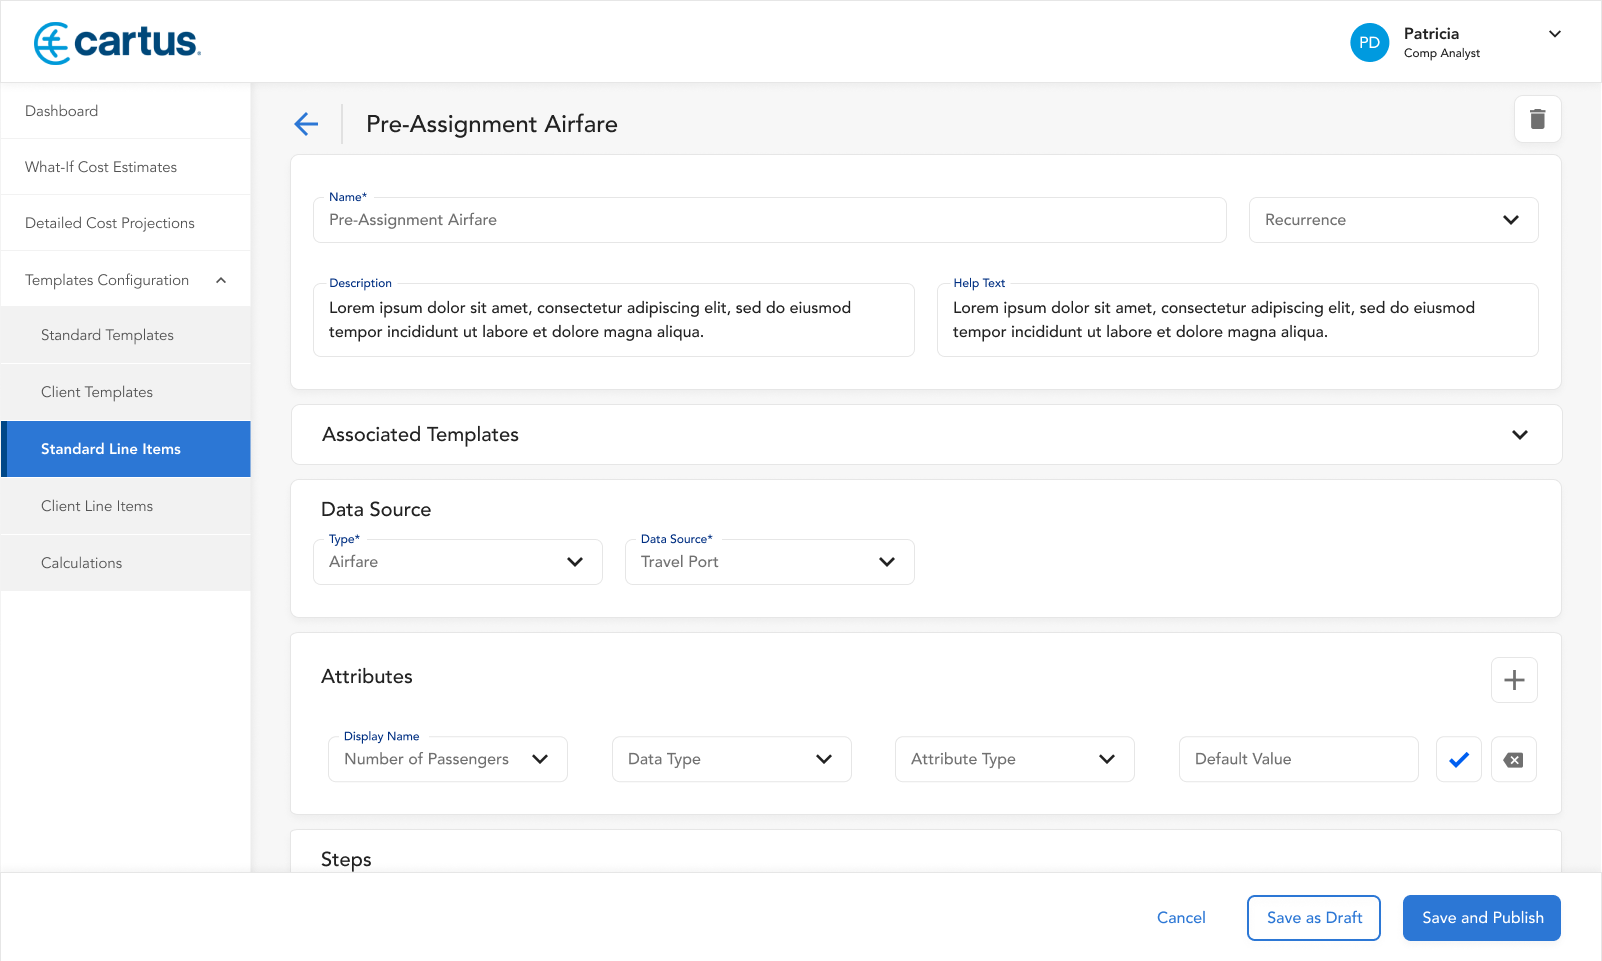
So as you can see from the first screen below, users are presented with a list of all available line items per the client they are working with. Users are allowed to drill the list to find particular items, create new line items, edit existing line items and also draft, publish or archive line items. The second screens show they typical the typical configuring of a line item. Users are prompted to enter in basic information, and setup the API. After those selections they are given the attributes that could be configured and can then setup calculations accordingly.
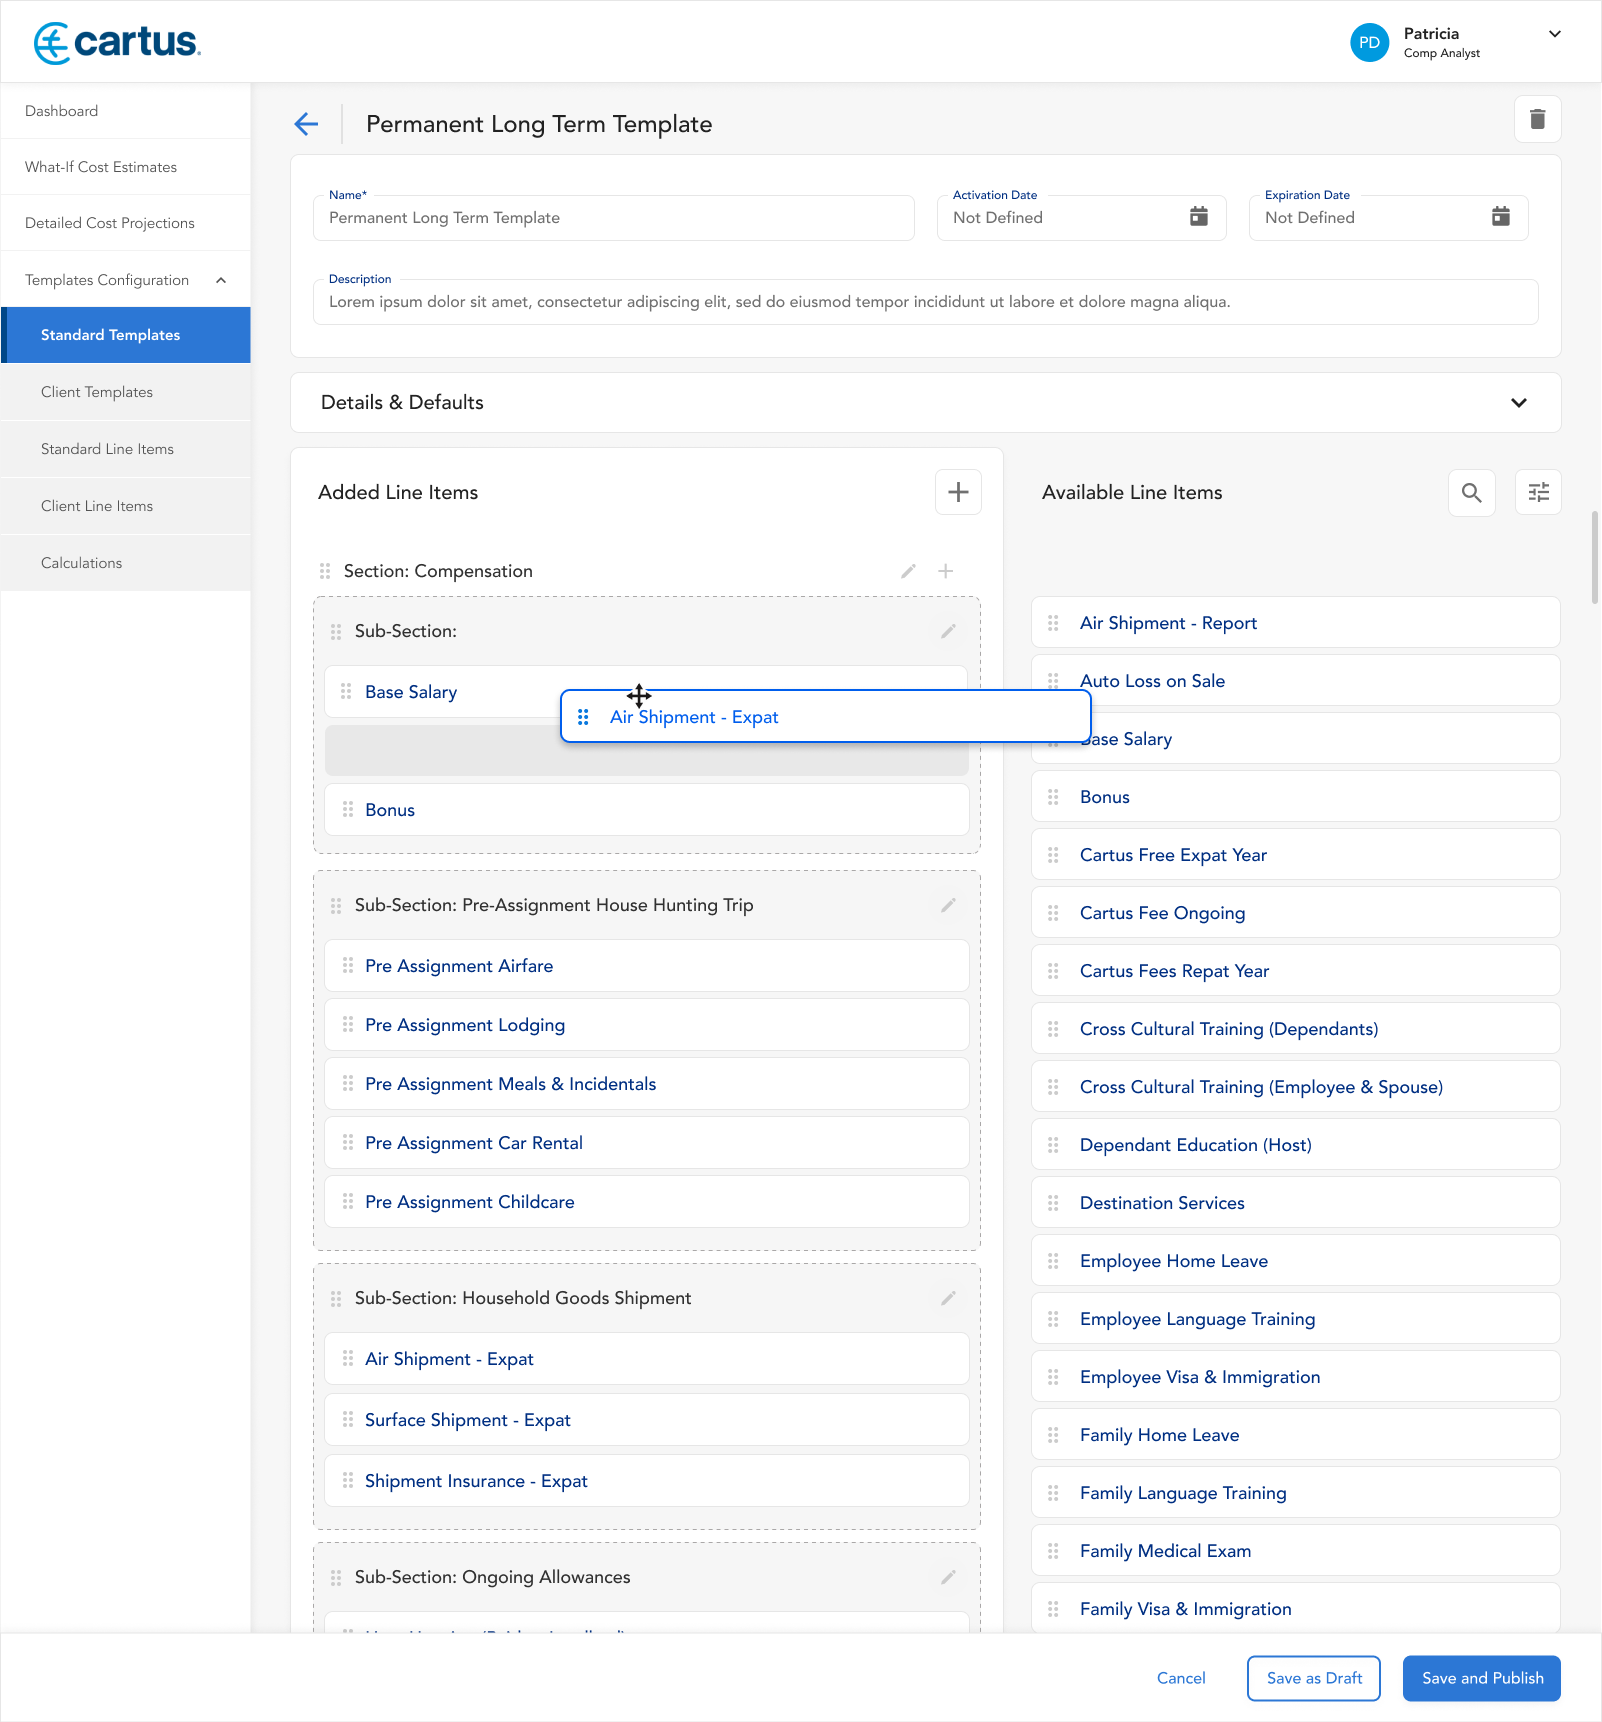
Scaling with Templates
With the design of the line items out of the way it was time to focus on templates. We wanted to make sure the system was very scaleable and that all elements were reusable as much as possible. So we created the system to use two type of templates, Standard Templates and Client Templates. Each cost projection starts with one of either types of templates, both are just preconfigured collections of line items, set structures, with set default values allowing the Comp Analysis to hit the ground running.
Client Templates offered the same advantage as standard templates but were to be configured solely for the client needs of those who are using them. Some clients might need a configuration such as, what vendors they use when it comes to air travel or they might want to implement a miles program into the line item API configuration. Client Templates gives them that flexibility to set up offset templates for those type of considerations while not exposing confidential client specific information.
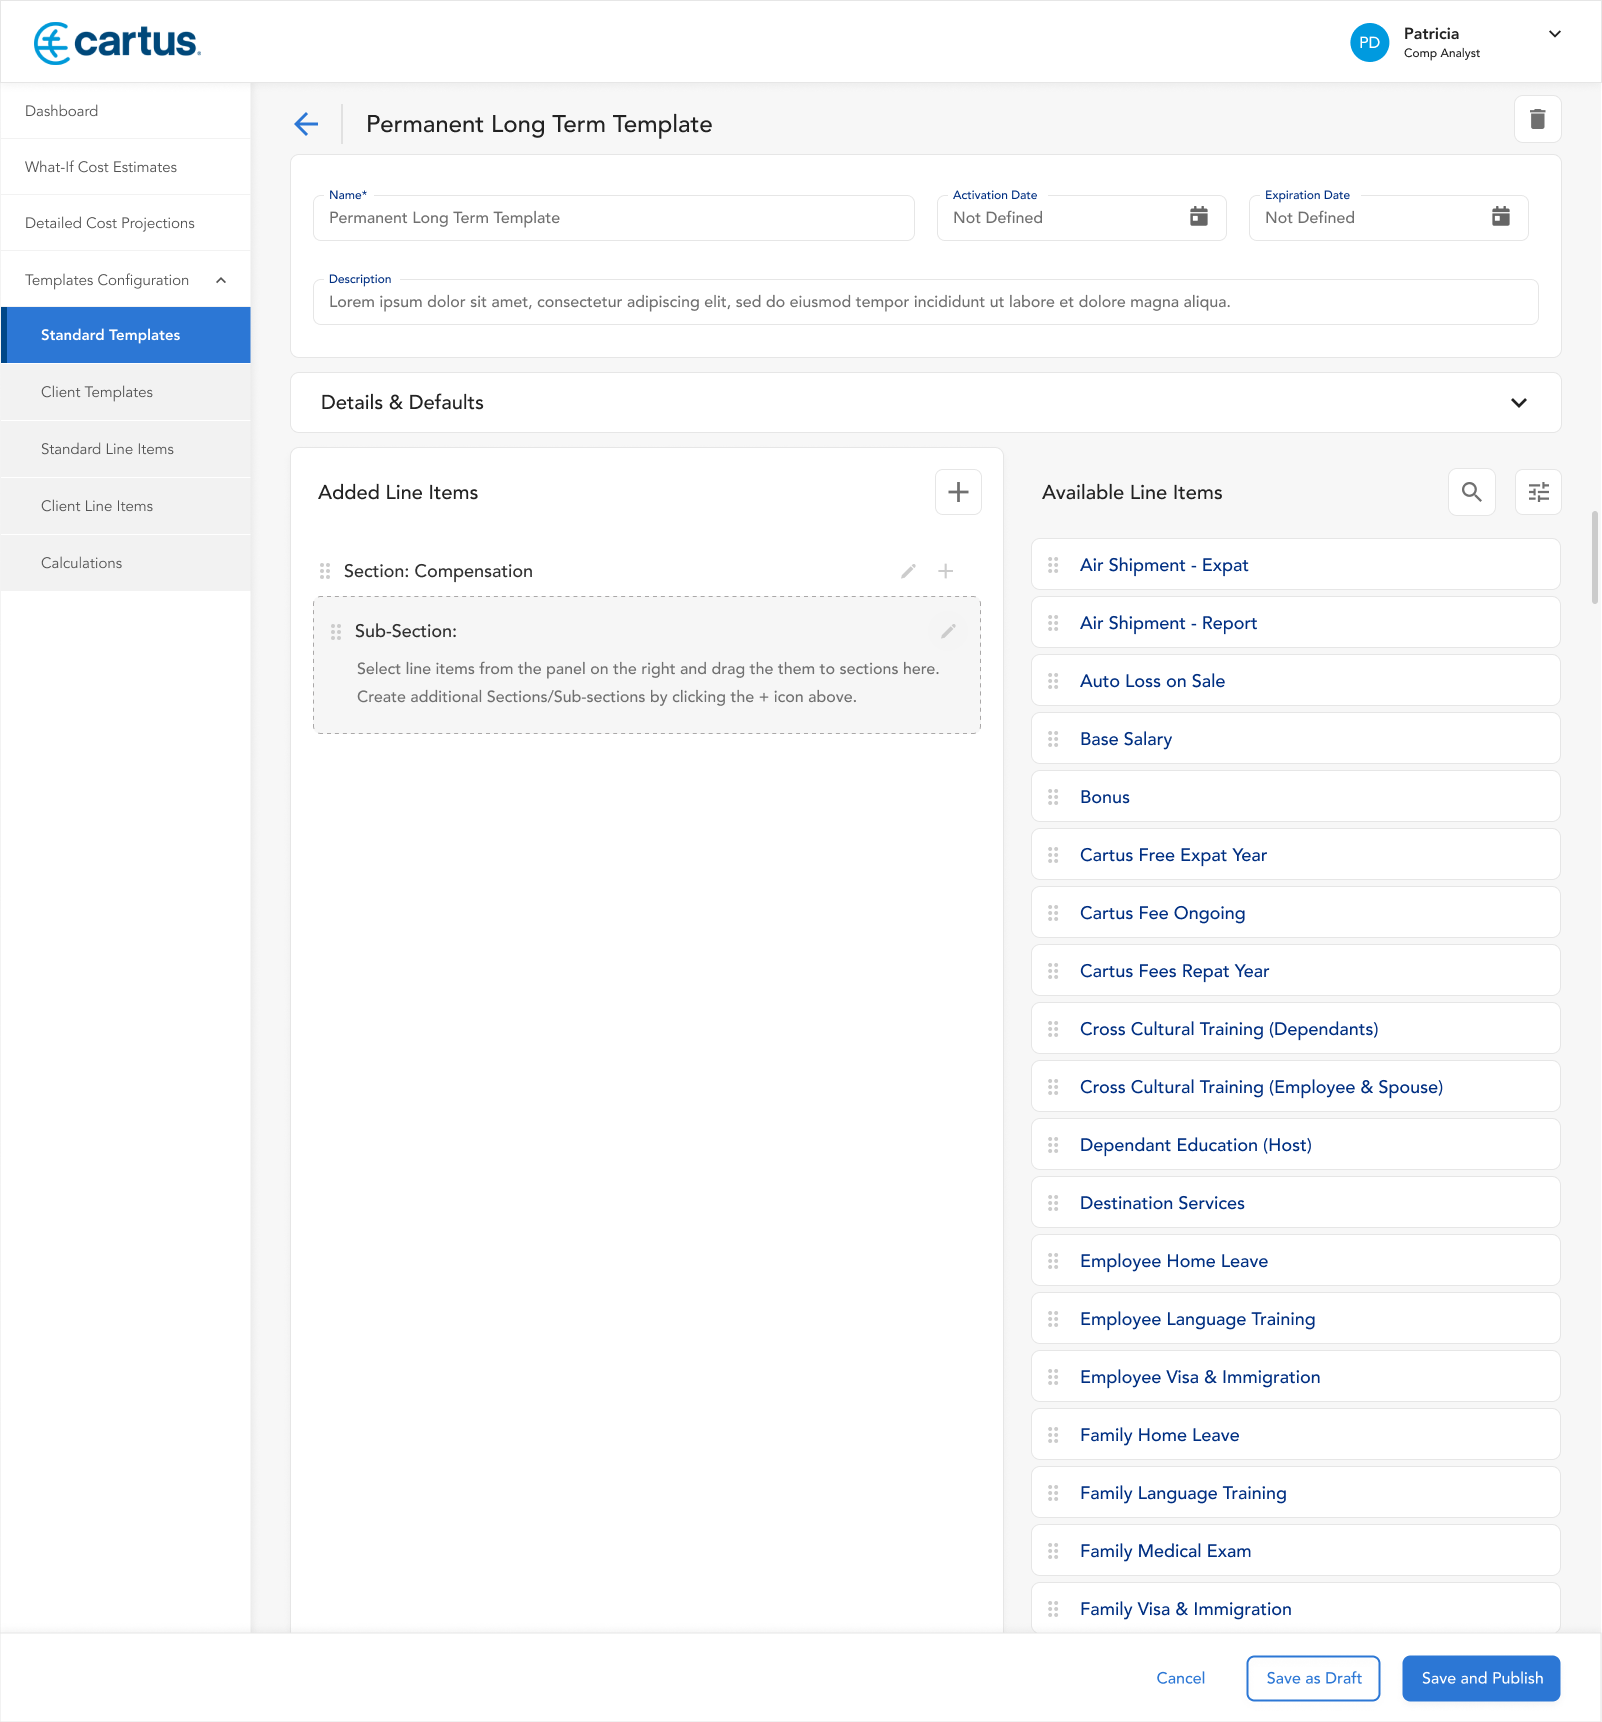
The usage of templates seemed like a no-brainer, We had heard from many users that configuration was monotonous and required many redundant steps. One thing I noticed right away in the old system, was how tedious it was to reorder line items. The previous way actually had the user assign a sequence number. So if you needed to move a line item around you had to go into all line items and refactor that number. That's a nightmare and is what guided the drag and drop solution you see below. Users now have the ability to select from a list of available line items and move them into the desired sections and subsections of the template on the left. If a user needed to reorder them it was now as visually moving them there.
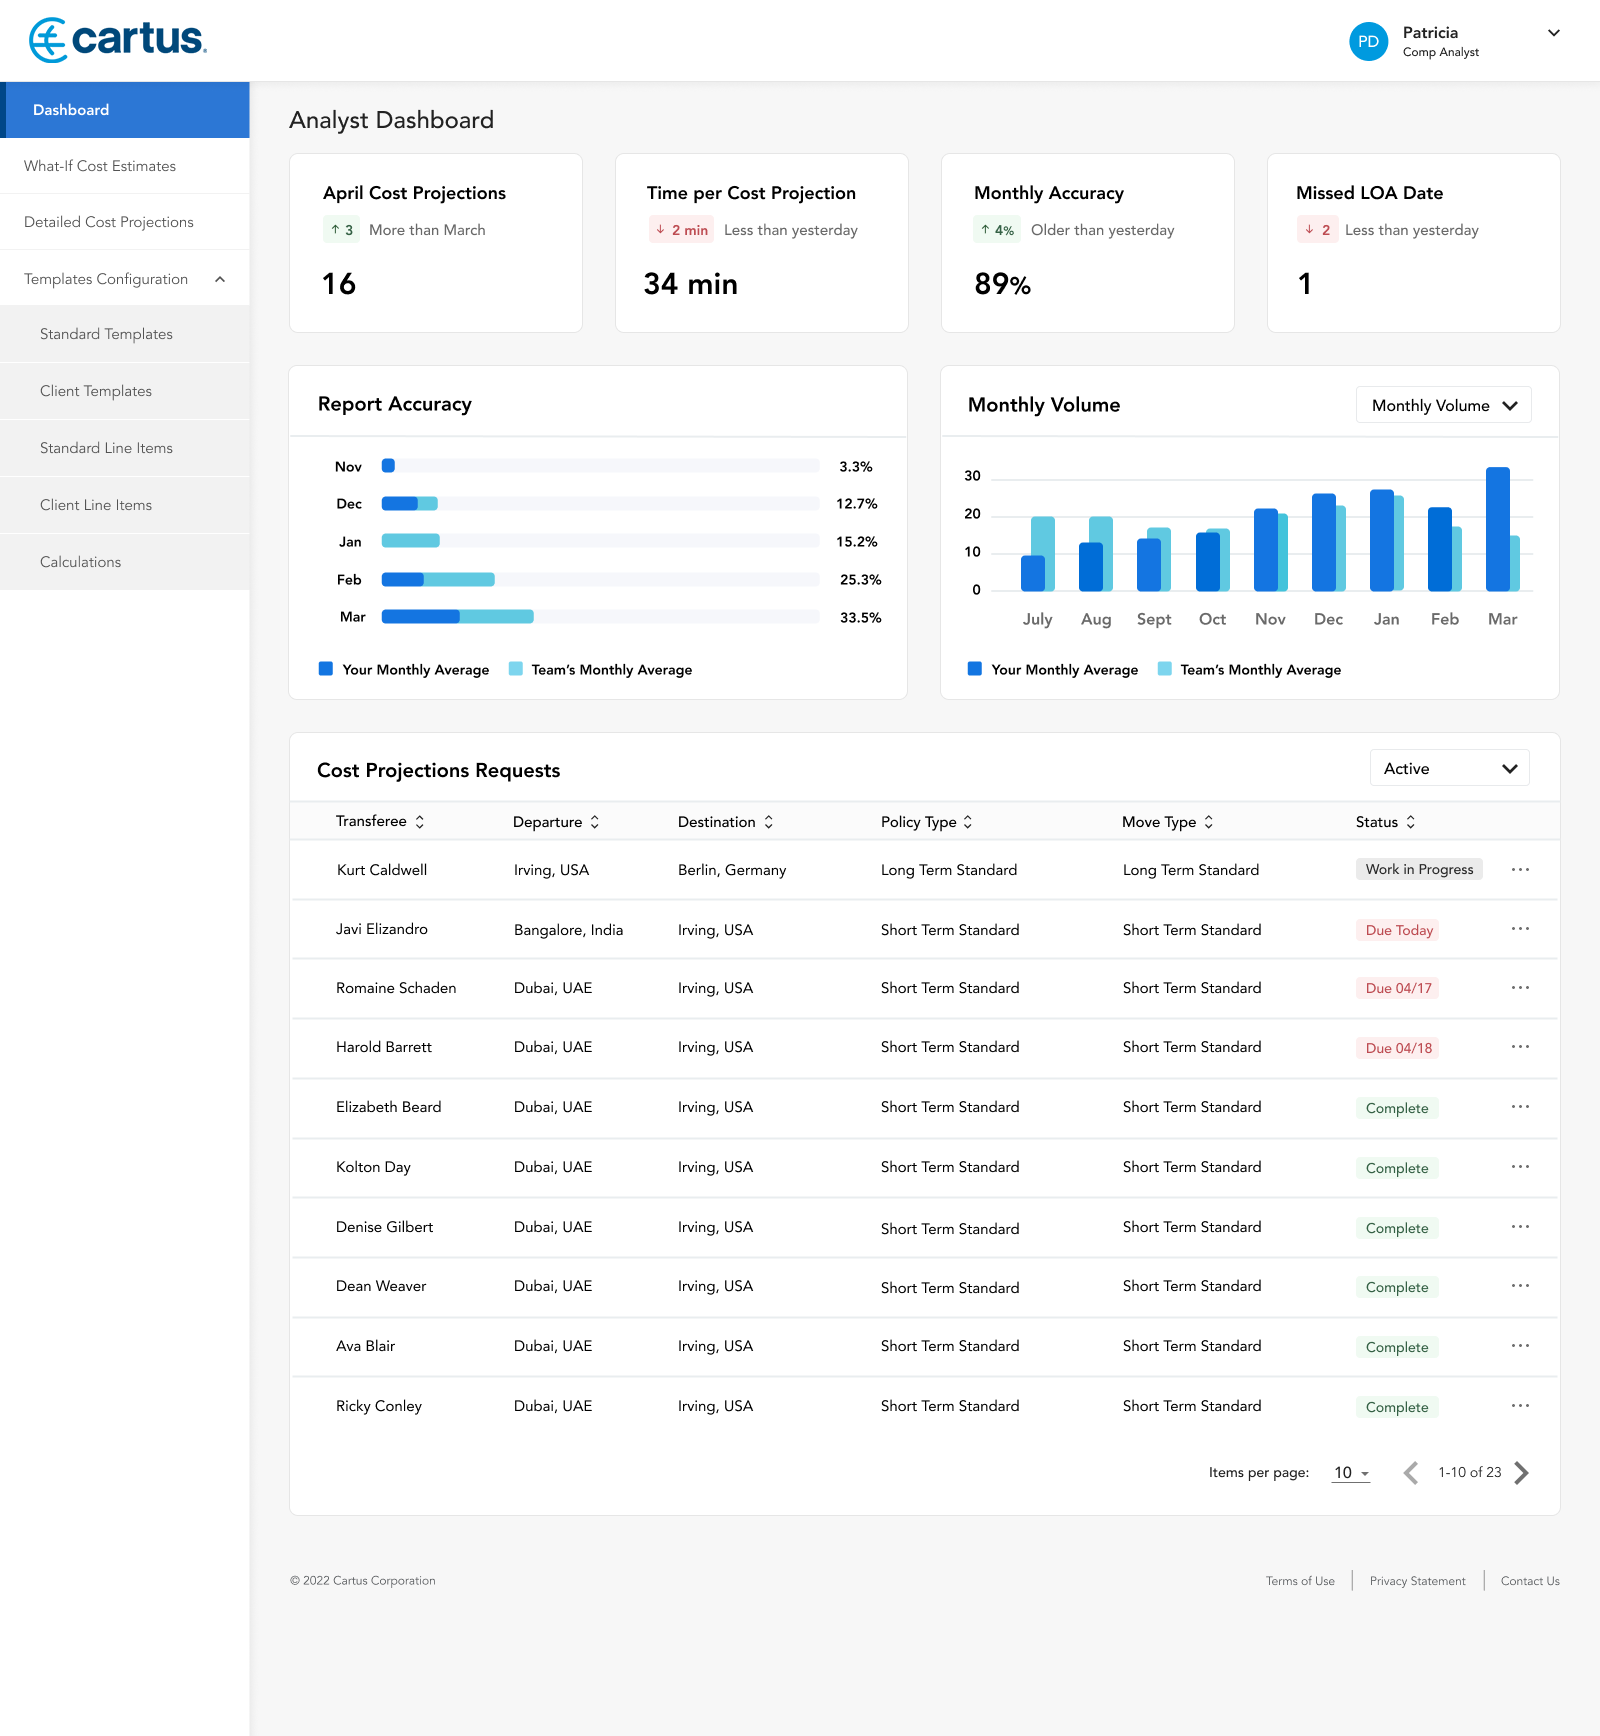
Dashboards
Since MVP priority was to get all components developed that would be required for running a cost projection only a dashboard for COMP Analysis was needed. In earlier stage we ran through excerise with our user groups do determine what type of dashboard items could most.